This is called a memory dump file, saved in the DMP file format. These files contain various information on the problem, including your current Windows version, any running apps and drivers at the time of the BSOD, and the error code itself. To help you analyze memory dump files, here’s what you’ll need to do.
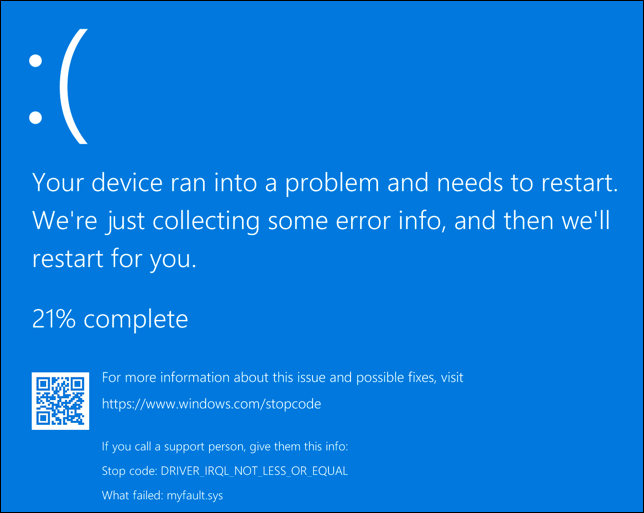
What are Memory Dump Files on Windows 10?
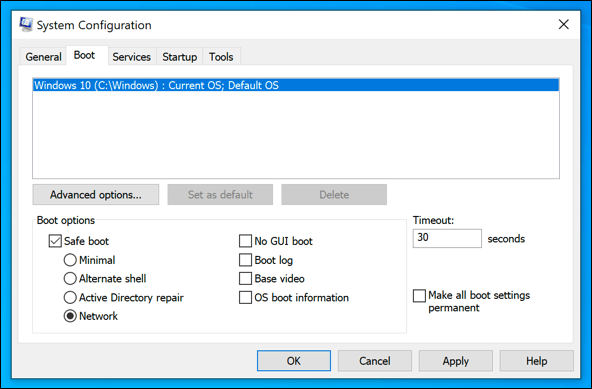
A Blue Screen of Death is a critical and unrecoverable error on a Windows PC, but the cause of these errors can vary. For example, an unexpected kernel mode trap BSOD is usually caused by incompatible or overclocked hardware, while a critical process died BSOD can have various causes, including corrupt system files. To help you troubleshoot the problem, Windows automatically generates a memory dump file. This usually contains the stop code name and value (e.g. a system service exception stop code), a list of any running drivers at the time of the crash, and some additional technical information that you can use to identify the cause. These dump files (using the DMP file format) are saved automatically in either the root C:, C:\minidump, or C:\Windows\minidump folders. To help you analyze them, you can install Microsoft’s debugging app WinDbg from the Microsoft Store. This helps you analyze the memory dump files and locate the stop code information. You can also use older tools like NirSoft BlueScreenView to quickly analyze the dump files created on your PC. This will also help you identify the stop code value and the possible cause (such as a specific driver file). Once you know the stop code value, you can then search for additional information online about the issue. For instance, if you discovered from your dump file that you suffered a memory management BSOD, you can check out our BSOD error guide for additional advice on how to resolve the issue. Because a BSOD error can stop your PC from working, you may need to try and restart Windows in Safe Mode. Running Windows in Safe Mode reduces the number of active system processes and drivers to the bare minimum, allowing you to investigate things further. If you can’t boot into Windows at all, however, your options are limited. Currently, there are no standalone tools that you can run if Windows itself isn’t working properly to analyze BSOD dump files. If this happens, you’ll need to recover the dump files using a Linux live CD using a DVD or a portable USB flash memory stick. You can then analyze the file using WinDbg or NirSoft BlueScreenView on a working Windows PC or laptop by following the steps below.
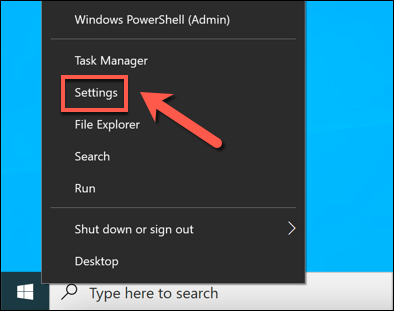
Changing Memory Dump File Settings in Windows Settings
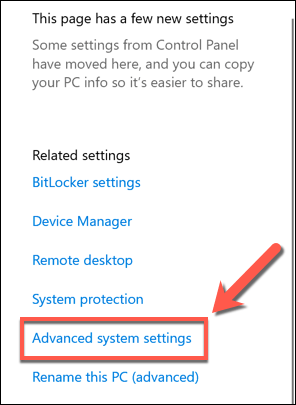
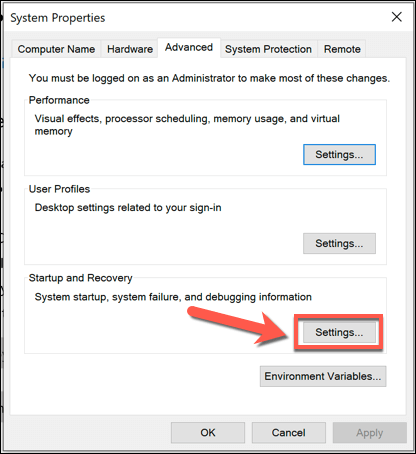
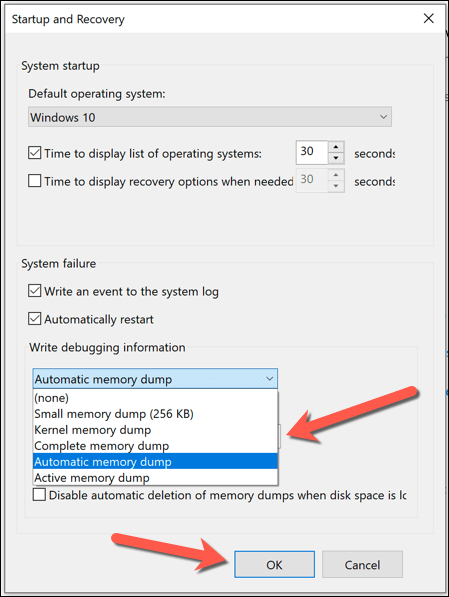
Memory dump files are created automatically, but you can set the level of detail included in a memory dump file in Windows Settings. This will only work for BSODs that occur after changing this setting, but if your PC is having problems, you can follow these steps to add additional information to the dump files. You may need to restart your PC after making this change to ensure the setting is applied. Any future BSOD errors that occur will generate a memory dump file containing the level of information you selected above.
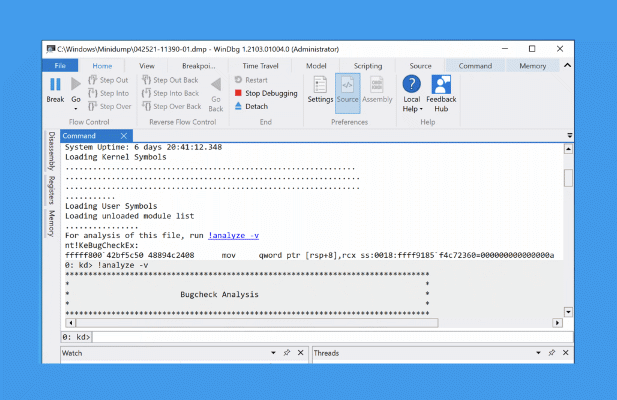
How to Analyze Windows Memory Dump Files Using WinDbg
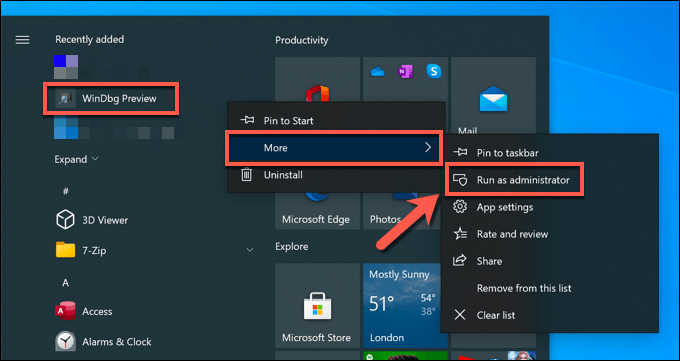
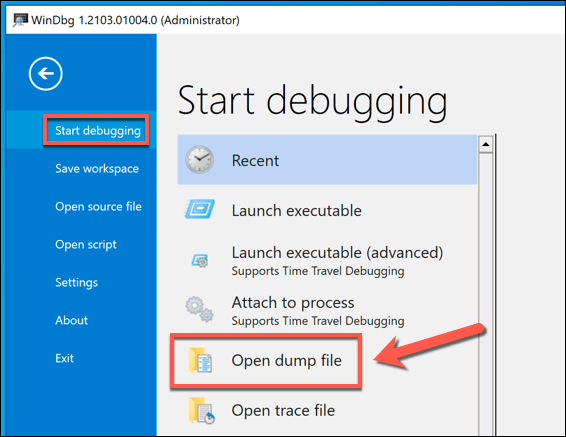
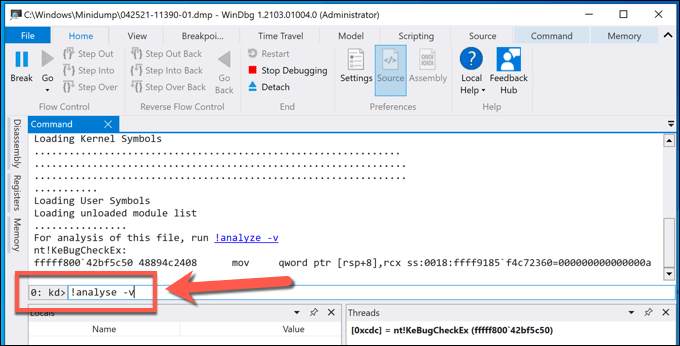
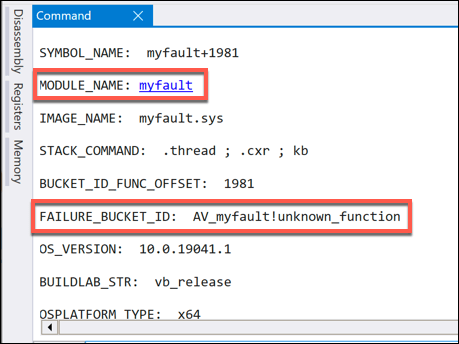
If you suffer a BSOD error, you can use WinDbg to analyze the memory dump file. This Microsoft-created development tool is the best way to analyze your memory files, but you can also use the older NirSoft BlueScreenView as an alternative, following the steps below. These steps assume your PC is working well enough to install and use WinDbg. If it isn’t, you’ll need to retrieve the dump files from your hard drive using a Linux live CD or USB to analyze them elsewhere. Live CD environments can be booted using the installation media of most Linux distributions, including Ubuntu and Debian. Once you’ve identified the stop code and possible cause of the BSOD error, you can research the issue further to determine a possible fix.
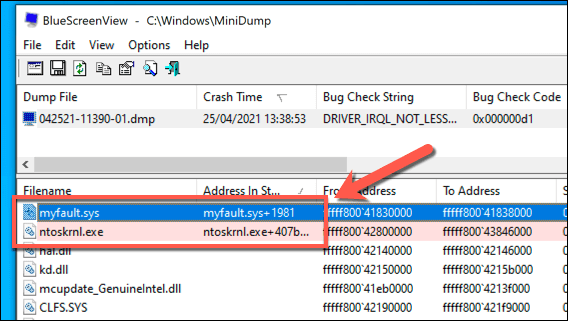
How to Analyze Windows Memory Dump Files Using NirSoft BlueScreenView
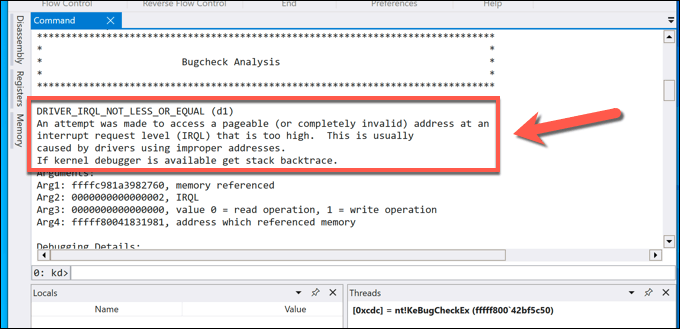
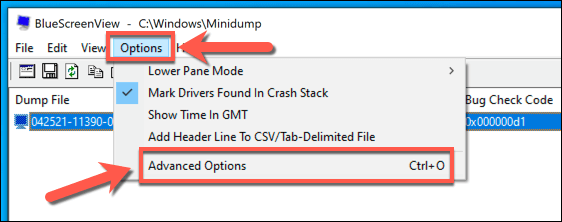
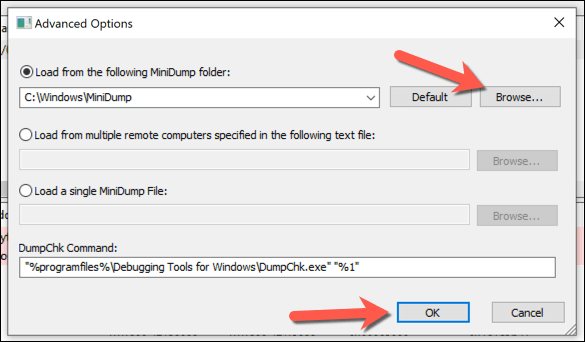
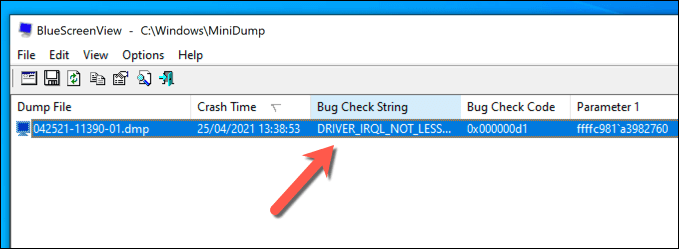
While WinDbg isn’t included with Windows, it’s produced by Microsoft to troubleshoot BSOD errors. If you’d prefer, however, you can analyze memory dump files from your PC (or from another PC if you have a copy of the relevant dump files) using the older NirSoft BlueScreenView tool. BlueScreenView may look dated, but it continues to offer all of the relevant information about your BSOD dump files. This includes the stop code name and value (such as DRIVER_IRQL_NOT_LESS_OR_EQUAL) that you can then use to identify the cause. While BlueScreenView is a useful tool for quickly identifying the BSOD error name, it isn’t a full debugging tool like WinDbg. If you can’t troubleshoot the problem using this tool, you’ll need to try WinDbg for a more detailed analysis.
Troubleshooting BSOD Errors Using Memory Dump Files
Using the memory dump file information you recover, you can troubleshoot the BSOD errors by searching for the stop codes or related BSOD error files. The error stop codes, in particular, can help you find the cause behind a BSOD, from a bad system config info BSOD to an unexpected store exception error BSOD. BSOD errors are caused by everything from faulty hardware to corrupt system files. To help stop them, you should check your PC for malware regularly and use tools like SFC to repair your Windows installation if it becomes corrupted. If all else fails, you can always reset or reinstall Windows 10 to restore your PC to full working order.