You can also create a Gantt chart in Excel, but a Google Docs Gantt chart is readily accessible over the cloud. You can allow authorized members edit access so they can collaborate on a Google Doc without having to send the spreadsheet back and forth via email.
Create a Google Docs Gantt Chart
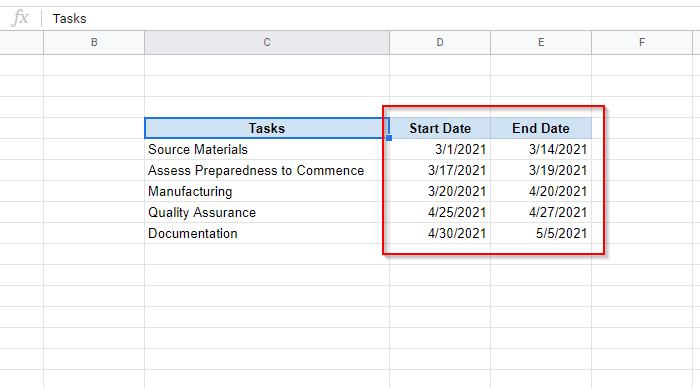
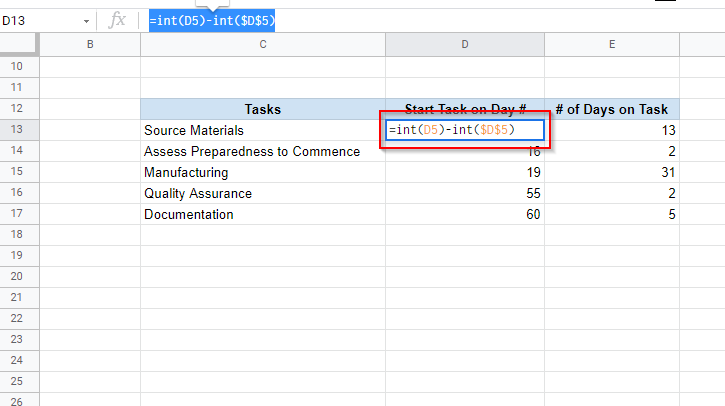
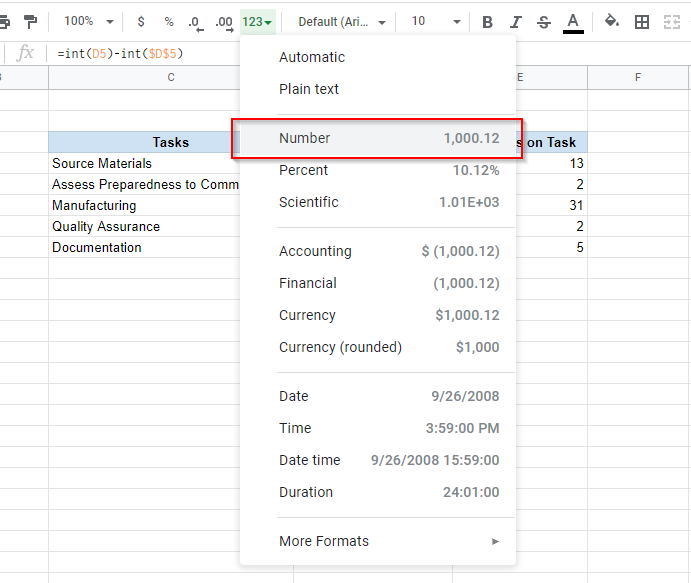
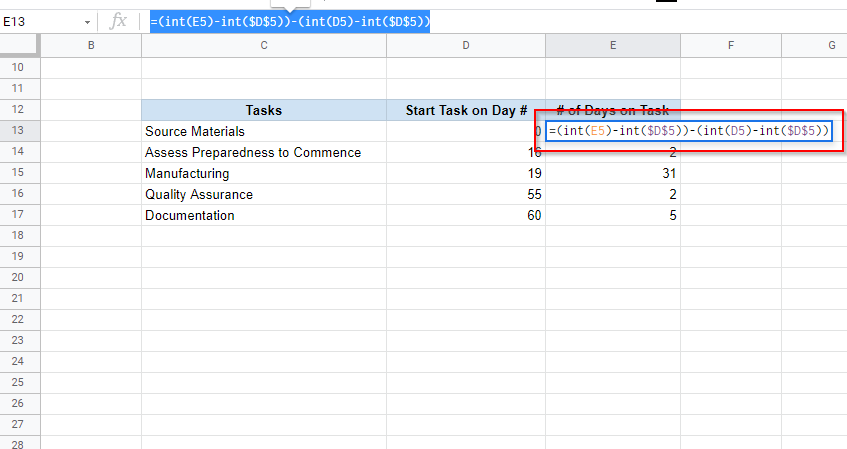
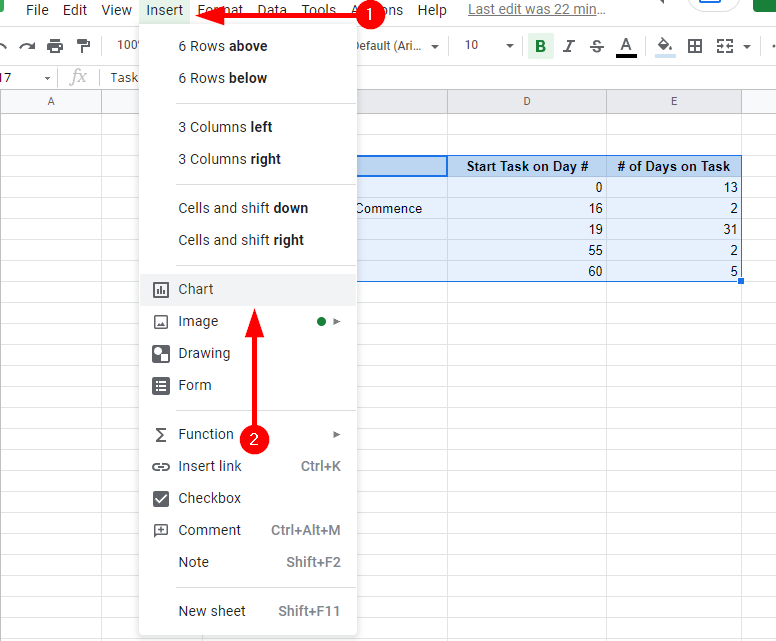
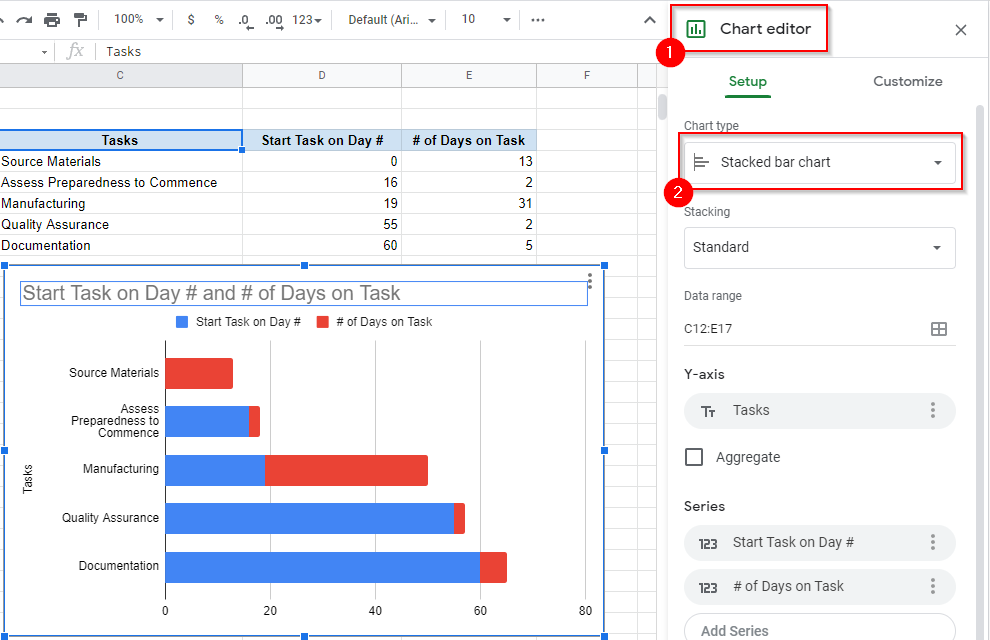
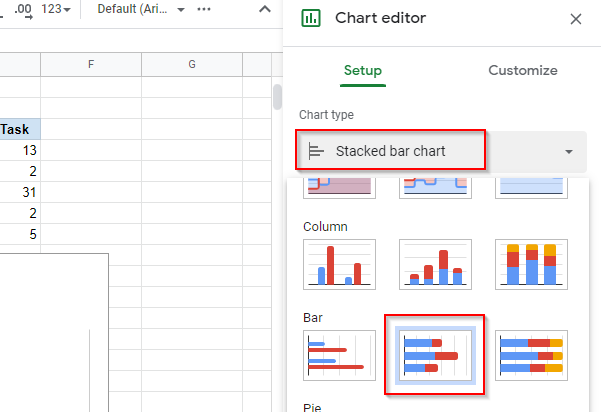
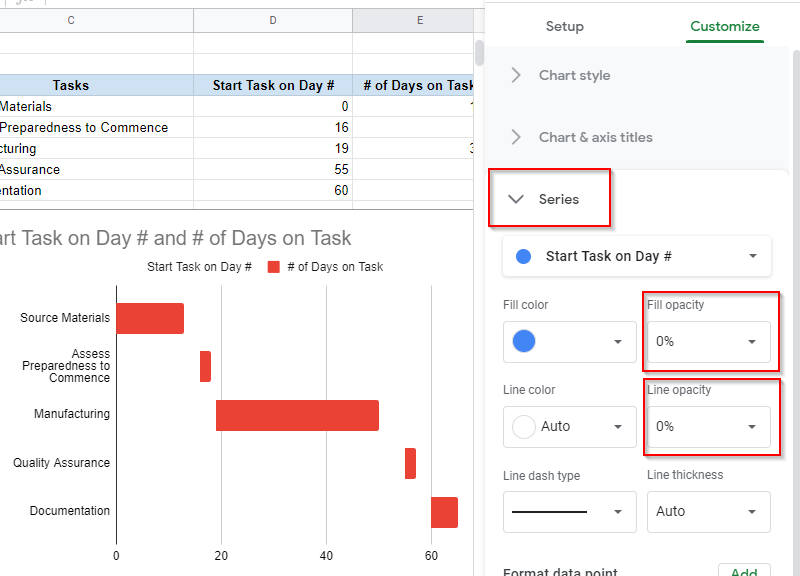
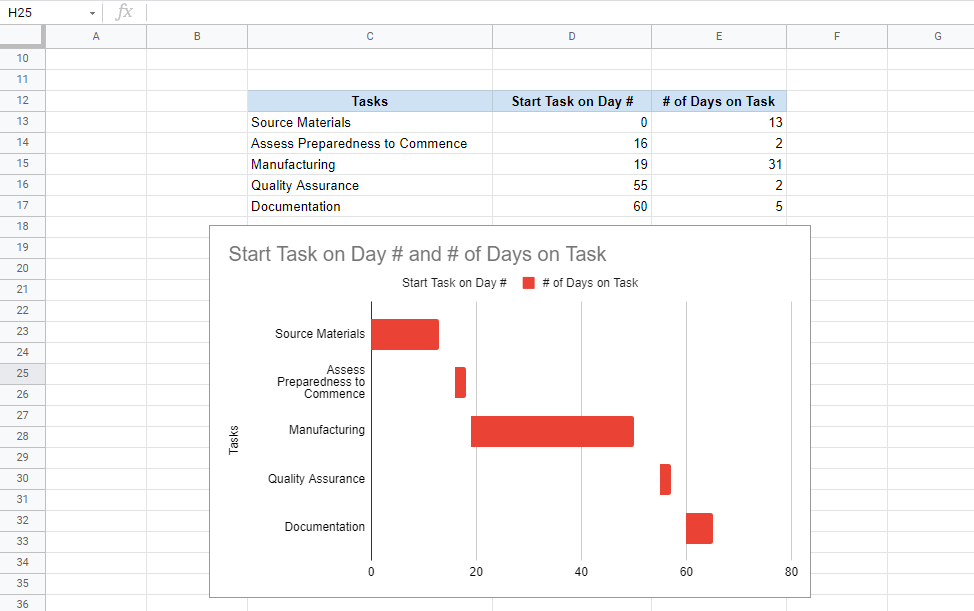
Before you get started with creating a Google Docs Gantt chart, you need to populate the Google worksheet with some data. Here’s how you can prepare each column: [A Task’s Start Date – The First Task’s Start Date] In this example, the following formula should be entered in the relevant cell: =int(D5)-int($D$5) Once you’ve entered the formula, you can apply the formula to the remaining cells by dragging the border selection. The dollar sign in the formula helps you preserve a cell reference when you apply the formula to other cells. The formula calculates the difference between two dates as an integer (that’s what the INT function does). Without the INT function, you may receive an output with a decimal value. If you see a date in the 1900s after entering this formula, make sure that you’ve formatted the cell as a number and not a date. [A Task’s End Date – The First Task’s Start Date] – [The Task’s Start Date – The First Task’s Start Date] In this example, the formula use to compute the number of days spent on a task is: =(int(E5)-int($D$5))-(int(D5)-int($D$5)) Be sure to enclose the two subtracting operations in parentheses. Otherwise, you could receive an incorrect output. When done, drag the border selection to apply formulas to the rest of the cells, just like you did for the previous column. Also, make sure the cells are formatted to display a number and not a date. That’s all you need to create a Google Docs Gantt chart. If you want, you can customize it further. You can rename the chart, name the horizontal and vertical axis, and explore other customization options in the Customize tab.
Create a Google Docs Gantt Chart with an Add-On
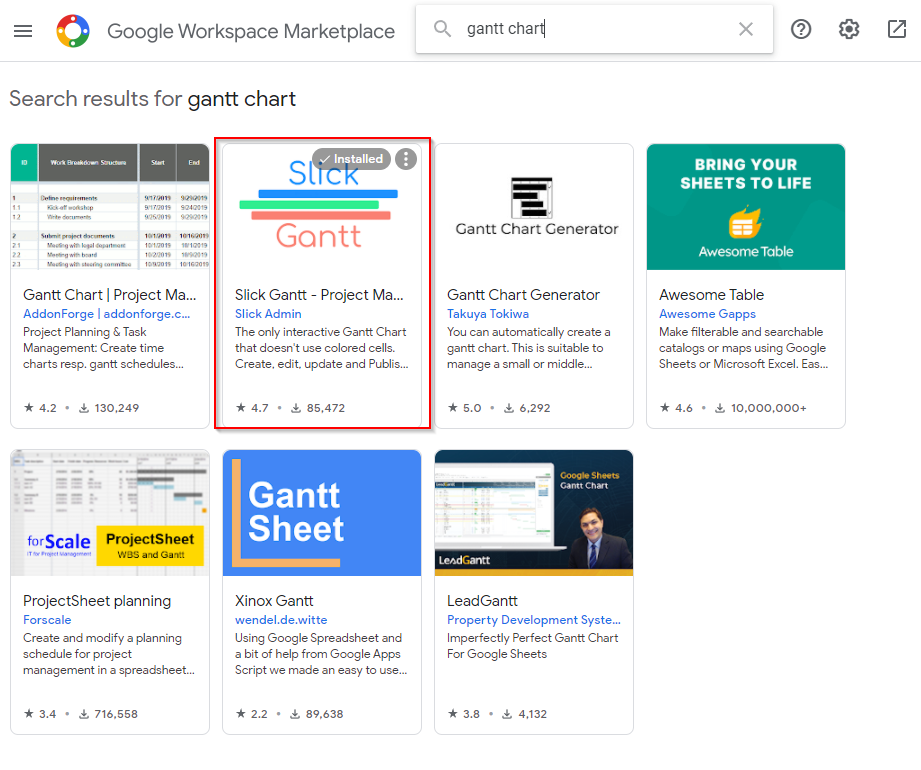
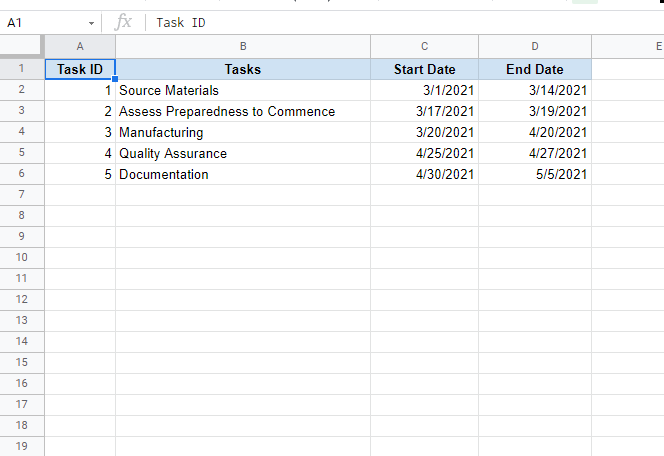
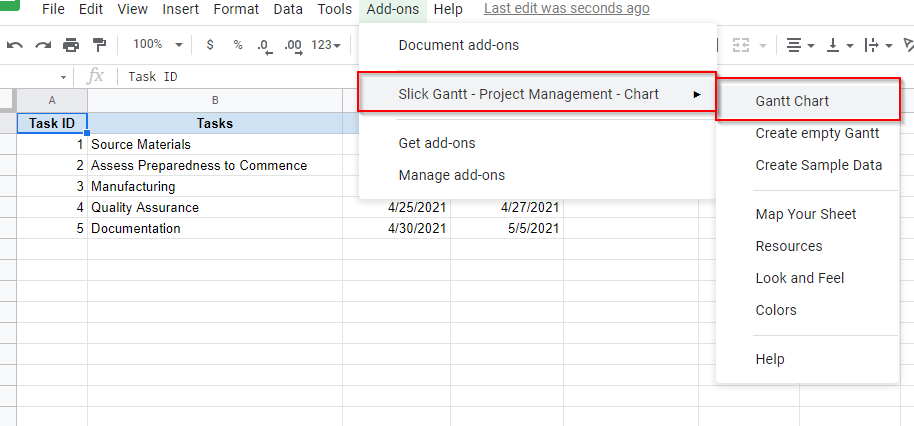
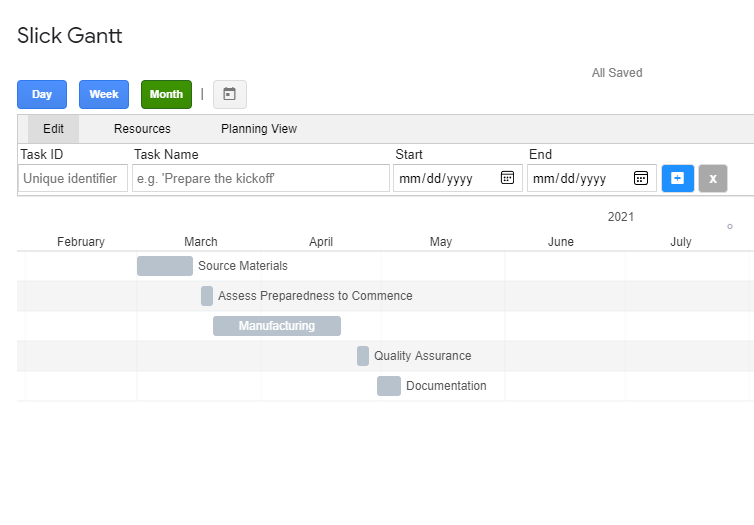
If you don’t want to spend time manually creating a Google Docs Gantt chart, you can always use one of the several Gantt chart add-ons available for Google Docs. To download an add-on, select Add-ons from the top ribbon, and select Get add-ons. Search for Gantt chart. Select Slick Gantt > Install. You could just as well select another one, but Slick Gantt is a no-fuss, easy to use tool. Once you’ve installed the add-on, go back to your Google sheet. There are two caveats you need to take care of before using Slick Gantt. You’ll first need to reposition your data. If you haven’t already, place the data such that it starts from cell A1, otherwise Slick Gantt will have trouble finding the data in your sheet. Plus, you’ll also need to add a Task ID column to your data since the add-on requires at least four fields (Task ID, Task Name, Start Date, and End Date). Once you’ve placed the data appropriately and added a Task ID column: There are several other add-ons you can use instead of Slick Gantt:
Your Google Docs Gantt Chart Is Ready
Once you’ve set up the chart, you can update it in real-time by updating the data in the sheet. Like how easy this was? You can also try making a scatter plot in Google Sheets, if that’s more relevant to your work.